The problem
Nobody above a school could see a single lesson
In 2021 and 2022, one Indian state set out to fix early reading and math in Classes 1 to 5. It retrained about 50,000 teachers and gave them new handbooks and workbooks. I worked on this mission at Central Square Foundation (CSF), the nonprofit that supported the state, as a Project Consultant acting as product lead.
Coaching in the classroom was meant to make the training stick. The state named about 2,200 senior headmasters as mentors, each visiting the schools in their cluster or sub-district. I argued for headmasters over the contract staff already on the payroll, whom teachers saw as data collectors.
But a visit left no record. The only checklist was a paper one about items such as midday meals, and nobody tracked it. Nobody could say whether a teacher used the new lesson steps, or whether a mentor had ever seen her teach.
The key decision
Record visits from week one, not month five
The state's app was due in January 2023. The mentors' training ran in August and September 2022, the one time all 2,200 would be in a room together. If their first four months of visits went unrecorded, I expected the habit to fade before the app arrived.
Ship a simple offline tool in the training weeks, rather than wait for the state's app
- The call
- Rebuild an assessment tool we already used as an offline observation tool, and put it in mentors' hands during their training.
- What I gave up
- Polish, and someone else to blame. CSF had never built or owned a tool, so every bug and all the data were ours.
- Why
- Training was the one moment every mentor was in a room. Months of recorded visits would also show what the real app needed.
Evidence · About 50,000 observations logged, starting in the mentors' first week of training.
Owning it was the hard part. I had to convince my manager, then CSF, then the state's education secretary and the commissioner. We started with the simplest version that would work in a real visit, and grew it from there.
The stopgap
An offline tool built in three weeks
Earlier in 2022 I had chosen Tangerine, an offline assessment app made by RTI International, for the state's baseline test of Grade 3 children, and built the tests in it myself. Weak networks were a big reason earlier government apps had failed in schools, so working without a signal mattered more than any feature.
I rebuilt it as a visit tool with two parts: an observation of the lesson against the lesson plan's expected steps, and a spot test, a quick check of five children chosen at random. I tested it with about 20 users, ran a pilot, then rolled it out to the mentors in their training sessions. It ran until the state app replaced it in December 2022.
Exhibit 1
One visit in the offline tool
- 01
Pick the school and the class
- 02
Observe the lesson against its expected steps
- 03
Test five children chosen at random
- 04
Save on the phone, with or without a signal
- 05
Send when the phone finds a network
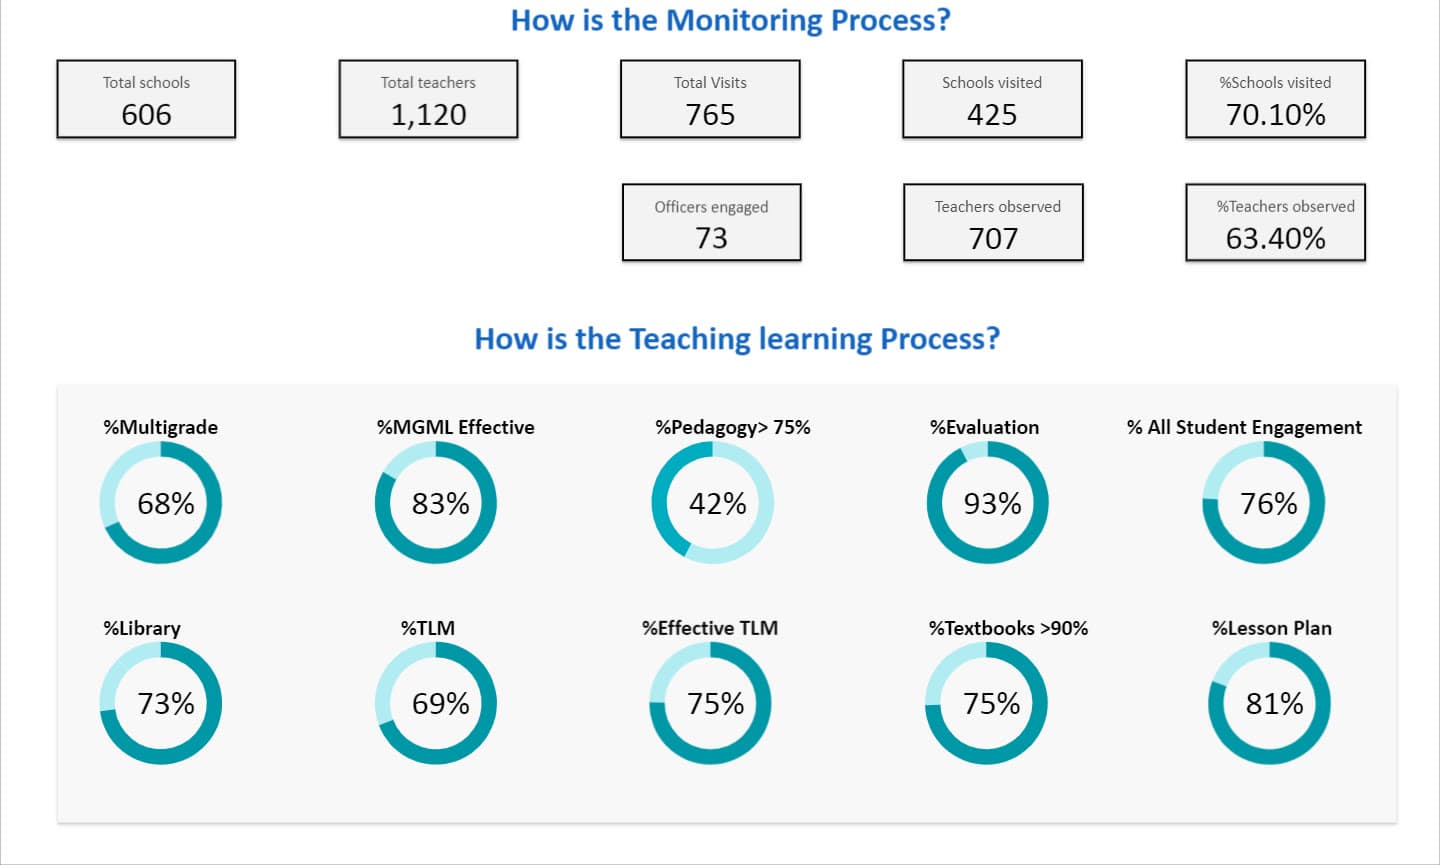
Data helps only if someone with power looks at it, and there was no budget. So I built the dashboard on free tools: a Google Cloud database joined to the state's school and teacher records, a Python script that refreshed it, and Google's free Looker Studio to show it. An official could drill down from the state to one teacher. One district's summary page is at the top of this page.
The hardest part was the counting rule. A regional-language lesson had six expected steps and an English lesson eight, with variations by type of class. "Followed the lesson plan" had to mean something different for each, or the dashboard would mark good lessons as failures.
So every number on the dashboard got a written definition with its denominator. My data session for district officials at the November 2022 refresher training set them out.
Exhibit 2
Every dashboard number had a written denominator
| Dashboard number | How it was counted |
|---|---|
| Schools visited | Schools visited ÷ all schools |
| Teachers observed | Teachers observed ÷ all teachers |
| Officers engaged | Officers who made at least one visit |
| Teaching steps followed | Teachers who followed at least 75% of the lesson's steps ÷ teachers observed |
| Every child engaged | Teachers who engaged every child in the class ÷ teachers observed |
| Relevant teaching aids | Teachers using aids that fit the lesson ÷ teachers using any aids |
The state app
The state's own vendor, so the state could keep it
The offline tool was a stopgap. From June 2022, in parallel, I wrote the vision for one app for the whole mission, from textbook delivery to classroom observation and student assessment, with one dashboard on top.
Build with the state's existing vendor, and lead its engineers
- The call
- Choose the state's existing technology vendor over a stronger outside one, and propose that I lead its engineering team directly.
- What I gave up
- The speed and quality of an outside team that had built apps like this before.
- Why
- The state already funded this vendor, which held the student, teacher and school databases. An app the state can run for years is worth more than a better one that stops when outside funding does.
The education secretary made me responsible for delivery. I wrote the roadmap, user stories and acceptance tests, and worked with the vendor's engineers module by module. With no designer on either side, I designed the screens in Figma and used clickable prototypes to get the department's agreement before any code was written.
What mentors struggled with on the offline tool became the requirements: awkward inputs were redesigned and tested with users, schools and teachers came straight from the vendor's databases instead of being matched later, and the pedagogy team's revised questions went in.
Each role sees only its own work: teachers assess their students monthly, mentors see visit targets against visits done, and officials see only their own district, sub-district or school. I sized the servers for every teacher in the state, about 150,000 by my planning figure. The app launched in December 2022, ahead of the January deadline.
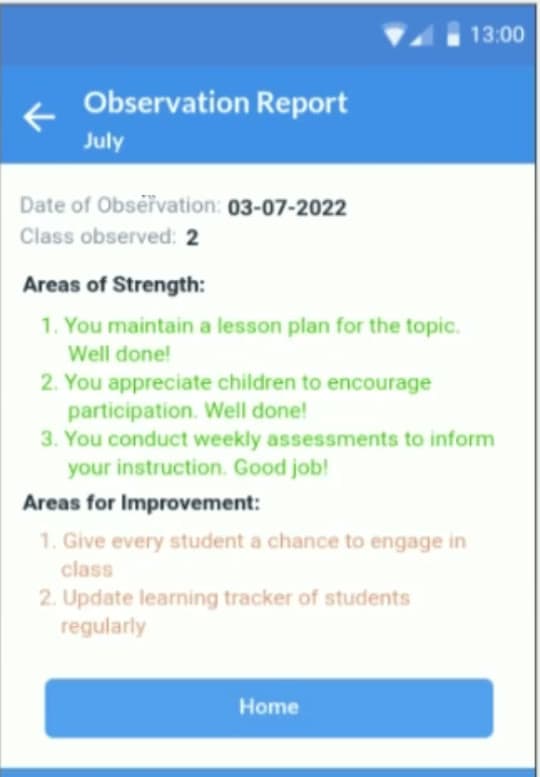
1My clickable prototype, mid-2022: what a teacher sees after a visit.
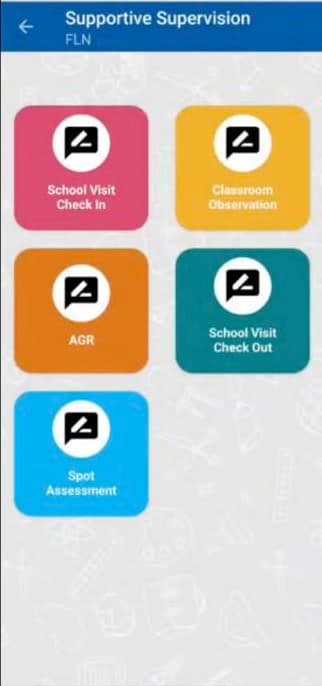
2The state app in 2025: one menu for the whole visit, check-in to check-out.
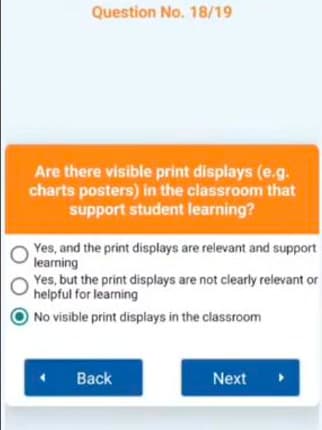
3Each observation question has graded answers, not yes or no.
Results
Visits were recorded at scale within four months
Use was built into routines mentors already had. Entering the observation became the last step on the mentor's visit checklist, and the numbers set the agenda of the monthly meetings where officials are reviewed, as one district's 2024-25 records show.
Exhibit 3
Visits, children tested and mentor training, measured
| What | Result | Status |
|---|---|---|
| Classroom observations logged | About 50,000 | Measured |
| Schools observed, Sep 2022 to Jan 2023 | About 15,600 | Measured |
| Teachers visited at least once, same period | About 28,600 of about 50,000 (about 57%) | Measured |
| Children given a spot test, same period | About 150,000 | Measured |
| The state app still in use | More than 100,000 installs | Live |
| Mentors meeting the knowledge benchmark after training, one district | 11 of 29 before, 22 of 29 after | Measured |
September 2022 to January 2023 spans the offline tool and the app's first weeks.
Next
What I would measure next
The system now records every visit and the share of lesson steps each observed teacher followed. The next test is whether that share changes. I would track it for the same teachers across visits, against a comparison group of teachers not yet visited.
Second, the quality of feedback. The app records that feedback happened. I would add what the mentor says to a teacher after a lesson, have people score a sample, and give mentors something useful back from the data they enter. That question is where my later work on coaching mentors began.
Third, one entry per visit. I would retire the paper visit diary once the app is in use, so mentors record each visit once.
Sources: CSF's 2023 article on the program, for every count; the app's store listing, accessed 1 Nov 2026; one district's 2024-25 visit diary and its Sept 2024 training test, aggregates only; the build, vendor decision and launch, 2022.